The Call Activities Report does not support IM and Presence Service and Cisco Unity Connection.
The Call Activities Report provides the following line charts:
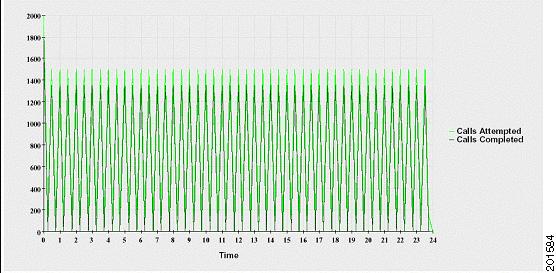
Cisco Unified Communications Manager Call Activity for a cluster
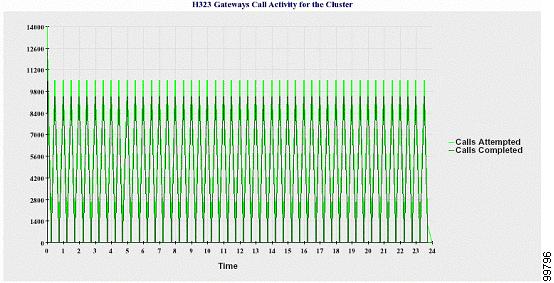
H.323 Gateways Call Activity for the Cluster
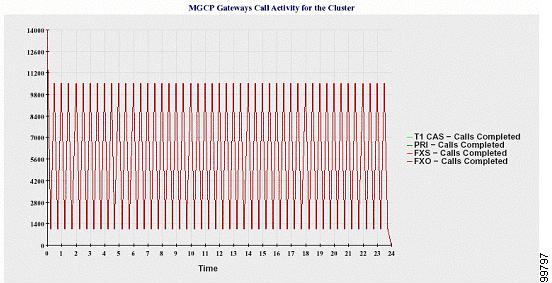
MGCP Gateways Call Activity for the Cluster
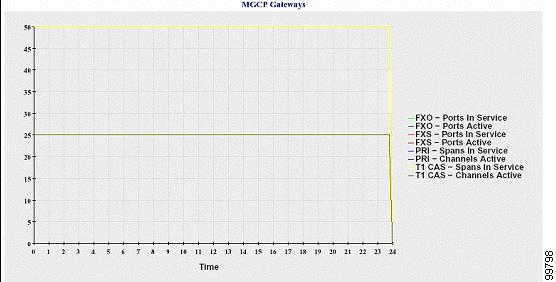
MGCP Gateways
Trunk Call Activity for the Cluster
Cisco Unified Communications Manager Call Activity for the Cluster
A line chart displays the number of Cisco Unified Communications Manager calls that were attempted and calls that were completed. In a Cisco Unified Communications Manager cluster configuration, the line chart displays the number of calls attempted and completed for the entire cluster. The chart comprises two lines, one for the number of calls that were attempted and another for the number of calls that were completed. For a Cisco Unified Communications Manager cluster configuration, each line represents the cluster value, which is the sum of the values for all the servers in the cluster (for which data is available). Each data value in the chart represents the total number of calls that were attempted or calls that were completed for a 15-minute duration.
If no data exists for Cisco Unified Communications Manager calls that were completed, Reporter does not generate the line that represents data for the calls that were completed. If no data exists for Cisco Unified Communications Manager calls that were attempted, Reporter does not generate the line that represents data for the calls that were attempted. In a Cisco Unified Communications Manager cluster configuration, if no data exists for a server in the cluster, Reporter does not generate the line that represents calls attempted or completed on that server. If no data exists for Cisco Unified Communications Manager call activities at all, Reporter does not generate the chart. The message "No data for Call Activities report available" displays.
H.323 Gateways Call Activity for the Cluster
A line chart displays the number of calls that were attempted and calls that were completed for H.323 gateways. In a Cisco Unified Communications Manager cluster configuration, the line chart displays the number of calls attempted and completed for the entire cluster. The chart comprises two lines, one for the number of calls that were attempted and another for the number of calls that were completed. For a Cisco Unified Communications Manager cluster configuration, each line represents the cluster value, which equals the sum of the values for all the servers in the cluster (for which data is available). Each data value in the chart represents the total number of calls that were attempted or calls that were completed for a 15-minute duration. If no data exists for H.323 gateways calls that were completed, Reporter does not generate the line that represents data for calls that were completed. If no data exists for H.323 gateways calls that were attempted, Reporter does not generate the line that represents data for calls that were attempted. In a Cisco Unified Communications Manager cluster configuration, if no data exists for a server in the cluster, Reporter does not generate the line that represents calls attempted or completed on that server. If no data exists for H.323 gateways call activities at all, Reporter does not generate the chart.
MGCP Gateways Call Activity for the Cluster
A line chart displays the number of calls that were completed in an hour for MGCP FXO, FXS, PRI, and T1CAS gateways. In a Cisco Unified Communications Manager cluster configuration, the chart displays the number of calls that were completed for the entire Cisco Unified Communications Manager cluster. The chart comprises four lines at the most, one for the number of calls that were completed for each of the gateway types (for which data is available). Each data value in the chart represents the total number of calls that were completed for a 15-minute duration. If no data exists for a gateway, Reporter does not generate the line that represents data for calls that were completed for a particular gateway. If no data exists for all gateways, Reporter does not generate the chart.
MGCP Gateways
A line chart displays the number of Ports In Service and Active Ports for MGCP FXO, FXS gateways and the number of Spans In Service or Channels Active for PRI, T1CAS gateways. For a Cisco Unified Communications Manager cluster configuration, the chart displays the data for the entire Cisco Unified Communications Manager cluster. The chart comprises eight lines, two lines each for the number of Ports In Service for MGCP FXO and FXS, and two lines each for the number of Active Ports for MGCP FXO and FXS. Four more lines for the number of Spans In Service and Channels Active for PRI and T1CAS gateways exist. For a Cisco Unified Communications Manager cluster configuration, each line represents the cluster value, which is the sum of the values for all servers in the cluster (for which data is available). Each data value in the chart represents the total Number of Ports In Service, Number of Active Ports, Spans In Service or Channels Active for a 15-minute duration. If no data exists for the number of Spans In Service or the Channels Active for a gateway (MGCP PRI, T1CAS) for all servers, Reporter does not generate the line that represents data for that particular gateway.
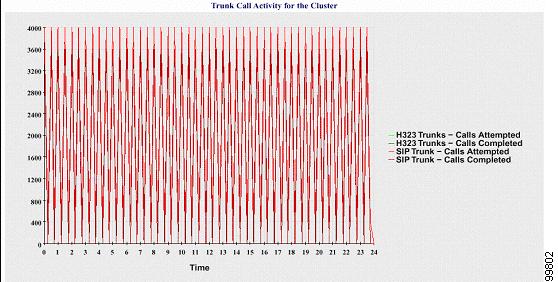
Trunk Call Activity for the Cluster
A line chart displays the number of calls that were completed and calls that were attempted in an hour for SIP trunk and H.323 trunk. For a Cisco Unified Communications Manager cluster configuration, the chart displays the number of calls that were completed and calls that were attempted for the entire Cisco Unified Communications Manager cluster. The chart comprises four lines, two for the number of calls that were completed for each SIP and H.323 trunk (for which data is available) and two for the number of calls that were attempted. For a Cisco Unified Communications Manager cluster configuration, each line represents the cluster value, which is the sum of the values for all nodes in the cluster (for which data is available). Each data value in the chart represents the total number of calls that were completed or number of calls that were attempted for a 15-minute duration. If no data exists for a trunk, Reporter does not generate the line that represents data for the calls that were completed or the calls that were attempted for that particular trunk. If no data exists for both trunk types, Reporter does not generate the chart.
The server (or each server in a Cisco Unified Communications Manager cluster configuration) contains log files that match the filename pattern CallLog_mm_dd_yyyy_hh_mm.csv. The following information exists in the log file:
Calls that were attempted and calls that were completed for Cisco Unified Communications Manager (or for each server in a Cisco Unified Communications Manager cluster)
Calls that were attempted and calls that were completed for the H.323 gateways (or for the gateways in each server in a Cisco Unified Communications Manager cluster)
Calls that were completed for the MGCP FXO, FXS, PRI, and T1CAS gateways (or for the gateways in each server in a Cisco Unified Communications Manager cluster)
Ports in service, active ports for MGCP FXO and FXS gateways and spans in service, channels active for PRI, and T1CAS gateways (in each server in a Cisco Unified Communications Manager cluster)
Calls that were attempted and calls that were completed for H.323 trunks and SIP trunks